

Ethereum Weakness Traces Back To One Exchange. Analyst Identifies The Cause

Ethereum is struggling to hold above $2,150 as selling pressure and market uncertainty continue to weigh on a recovery that has now given back a meaningful portion of its gains from the February lows. The price is under pressure — and analyst MorenoDV has published an exchange flow analysis that identifies exactly where that pressure originated and what the data is now showing in its aftermath.
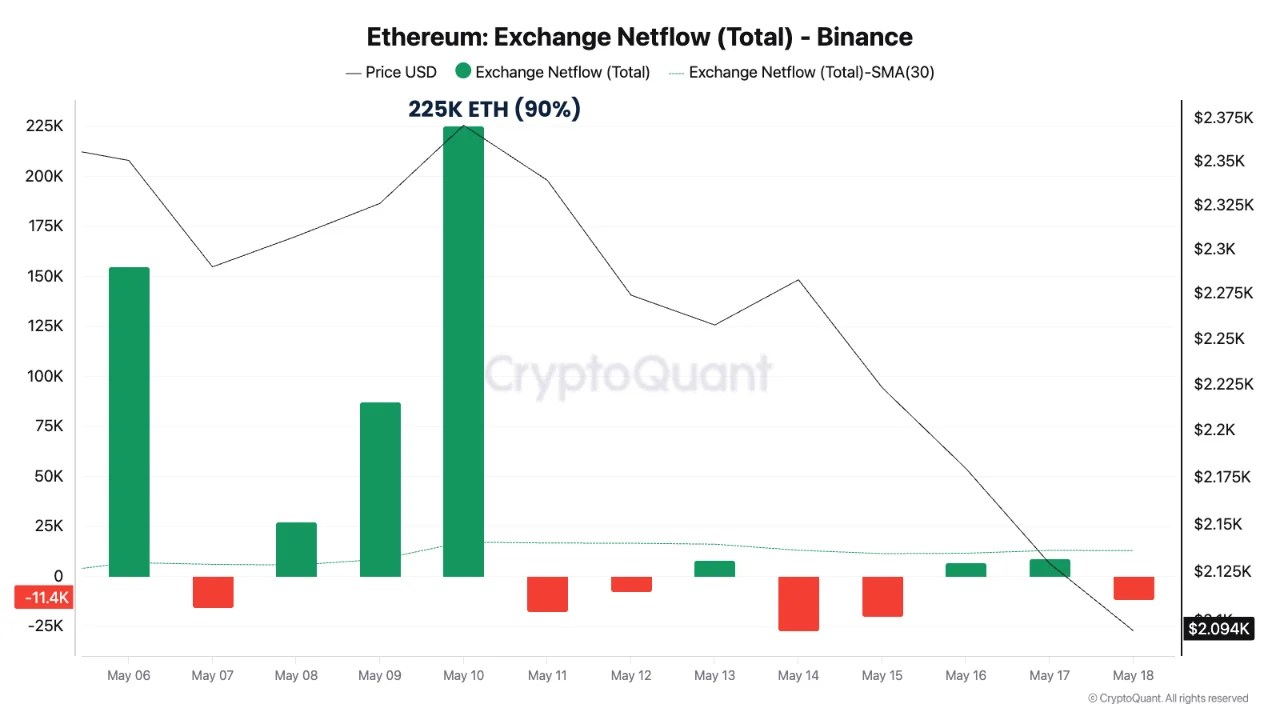
The finding that anchors the analysis is striking in its concentration. On May 10, as 250,000 ETH flowed into exchanges across all venues simultaneously, Binance absorbed 225,000 of them — 90% of the entire market’s exchange inflow in a single day, concentrated on a single platform. The implication MorenoDV draws from that concentration is structural rather than coincidental: what happens to Ethereum increasingly is what happens on Binance. The exchange has become so dominant in ETH flow dynamics that its behavior effectively defines the market’s behavior.
That observation alone would be significant. But MorenoDV’s analysis identifies a second development — a divergence that has opened in the data since May 10 — that changes how the current price weakness should be interpreted and what the Binance flow data is now beginning to signal about what comes next.
The divergence is where the more important story lives.
Binance Drove the Market Drop
The divergence MorenoDV identifies is precise and consequential. Binance has shifted from the net-inflow posture that characterized the May 10 event to a net-outflow position, currently bleeding approximately 12,000 ETH back out of the exchange. Meanwhile, the all-exchanges aggregate still shows marginally positive inflows of around 20,000 ETH — meaning the rest of the market continues to absorb mild deposit pressure while the venue that led the drawdown is now moving in the opposite direction.

That asymmetry is the signal. The May 10 drawdown was not the product of a broad, uniform wave of exchange inflows spreading evenly across the market. It was the product of a single venue absorbing 90% of the flow in a single day — a concentration so extreme that it effectively defines the entire event as a Binance story rather than a market-wide one.
MorenoDV’s framework for interpreting concentrated Binance inflows identifies four possible motivations: execution of a large sale, hedging against existing exposure, forced repositioning triggered by margin or collateral requirements, or active distribution from a large holder reducing their position. Each motivation carries different implications for how long the selling pressure persists and how the market recovers from it.
The flip to net outflow does not resolve which motivation drove the May 10 concentration — but it does confirm that the dynamic has changed. The exchange that absorbed 225,000 ETH on the way down is now returning coins to the market rather than accumulating more. For Ethereum struggling to hold $2,150, that directional change in the venue that matters most is the data point worth watching most closely.
Ethereum Breaks Below Key Support
Ethereum is trading near $2,115 after losing the critical $2,150 support region, a breakdown that significantly weakens the recovery structure built throughout April. The daily chart shows ETH falling below the 100-day moving average while remaining firmly beneath the descending 200-day moving average, confirming that the broader trend still favors sellers despite previous rebound attempts.
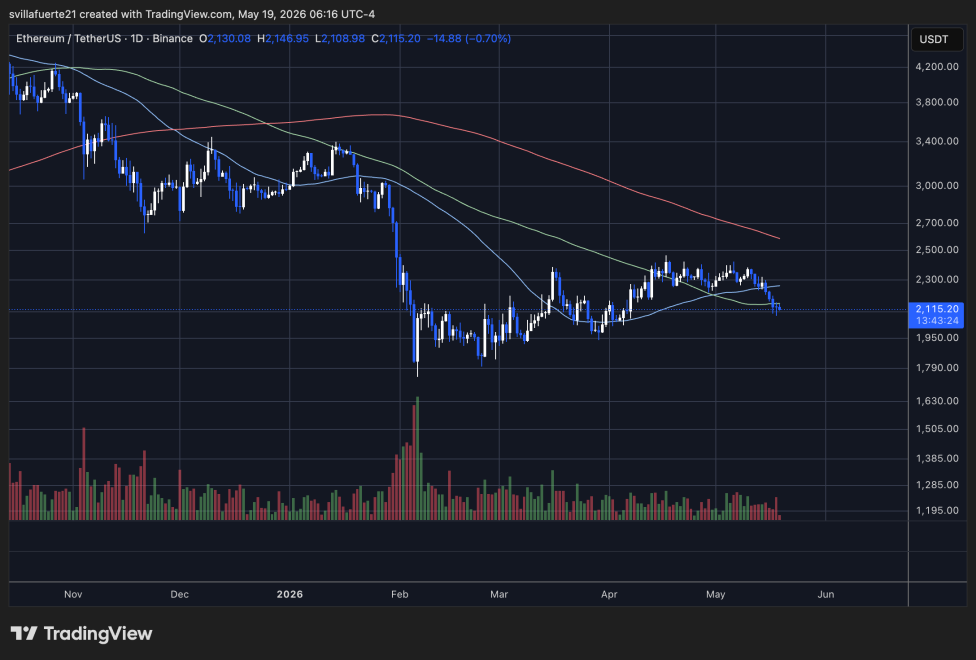
The recovery from the February capitulation lows near $1,800 initially showed constructive momentum, carrying Ethereum back toward the $2,300-$2,400 resistance zone. However, bulls repeatedly failed to reclaim higher levels, and price gradually rolled over as buying strength faded beneath long-term resistance.
The latest decline stands out because of the clear increase in supply pressure near local highs. Volume expanded during the rejection from the $2,350 area and remained elevated as ETH broke lower, suggesting active distribution rather than passive consolidation. This aligns with the recent Binance flow data showing a concentrated wave of ETH inflows arriving on the exchange before the breakdown accelerated.
Technically, Ethereum is now approaching a decisive support area between $2,050 and $2,100. Holding this region could allow the market to stabilize after the recent flush. However, a confirmed breakdown below it would likely expose Ethereum to another move toward the broader demand zone near $1,900-$2,000, where buyers previously defended price aggressively after February’s crash.
Featured image from ChatGPT, chart from TradingView.com