
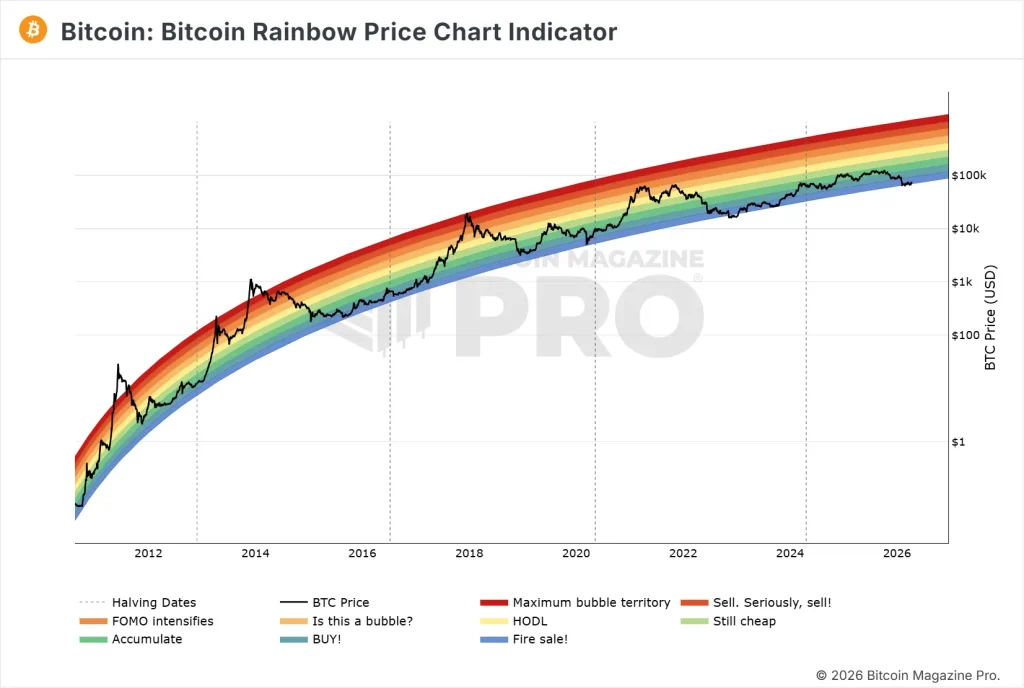
While Bitcoin (BTC) sits roughly 44% off its cycle highs and the broader crypto market grinds through one of the longest stretches of red monthly closes in history, a quiet revolution is underway. Institutional adoption is accelerating, Washington is inching toward regulatory clarity, and a new class of publicly traded companies like Digital Asset Treasury (DAT) firms are aggressively accumulating crypto at a pace that dwarfs daily issuance.
According to analysis by Sandman Markets, the setup creates a compelling asymmetric opportunity for investors willing to look beyond headline price action. From Federal Reserve rate cuts and ETF inflows to explosive on-chain accumulation by companies like MicroStrategy ($MSTR) and emerging players such as $HYPD and $DFDV, the data points to a looming supply crunch and significant upside for undervalued DAT stocks.
The Macro Tailwinds: Liquidity, ETFs, and Institutional Buying
The Federal Reserve has already begun its easing cycle. After holding the Fed Funds Rate at 5.25–5.50% through September 2024, policymakers have cut to the current 3.50–3.75% range, with markets pricing in further reductions toward 3.00–3.25%. Headline CPI sits at 3.3% year-over-year, but a key technical adjustment arrives in May: tariff-related inflation effects will roll off the year-over-year comparison, potentially shaving 0.5–0.8 percentage points off the reading.
Should the Iran conflict de-escalate quickly, the path to the Fed’s long-term 2.0% target becomes far clearer. This monetary easing is already showing up in crypto-specific flows. Over the past 10 days, spot Bitcoin ETFs have averaged $52.1 million in daily net inflows—the equivalent of roughly 733 BTC per day at current prices.
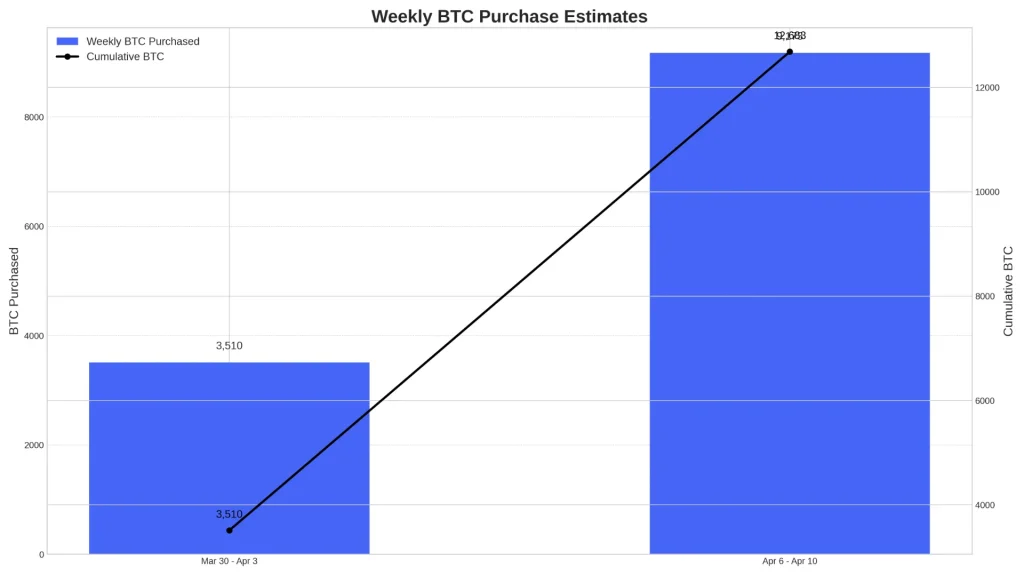
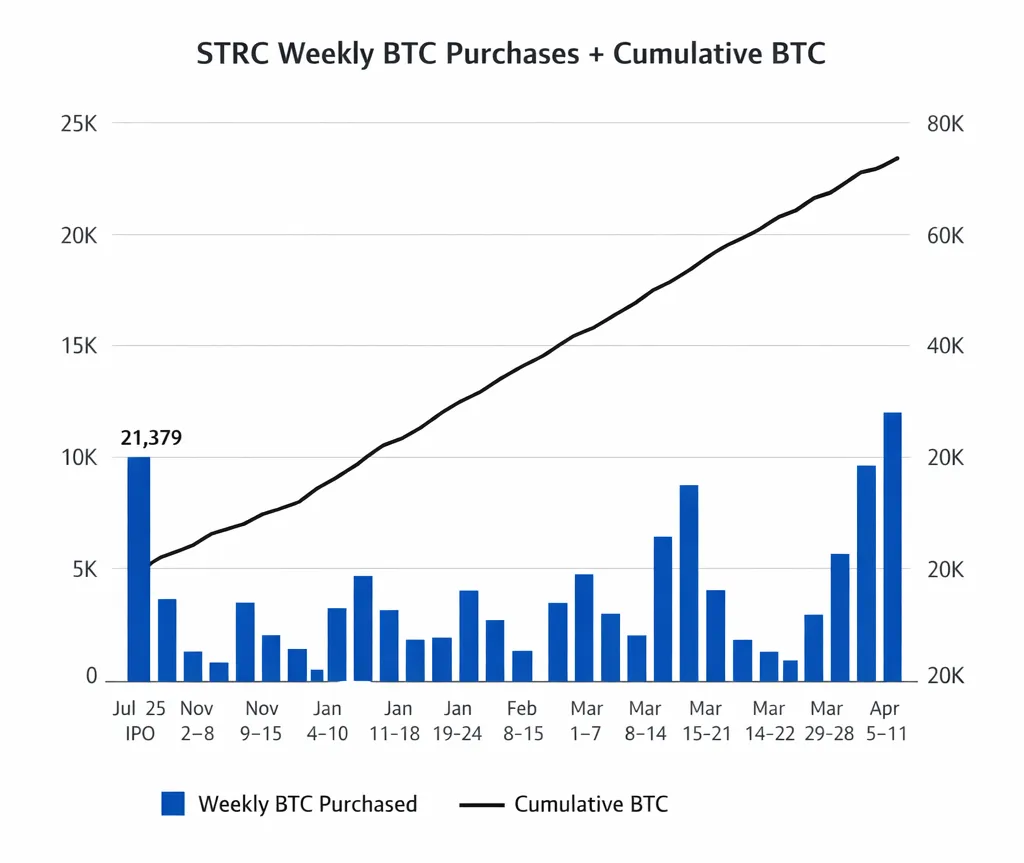
At the same time, MicroStrategy continues its legendary accumulation via its $STRC ATM program. Since $STRC’s IPO in July 2025, the company has purchased 55,664 BTC (an average of 225 BTC/day). The pace has recently accelerated dramatically: over the past two weeks alone, $MSTR added 12,683 BTC, or 905 BTC per day—outstripping ETF inflows.
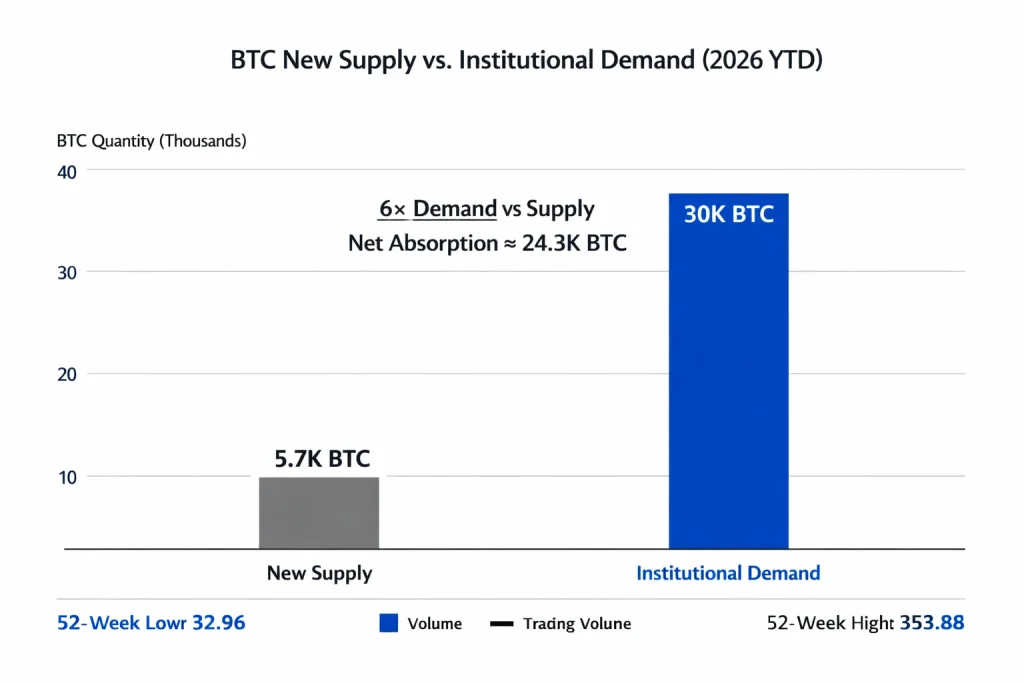
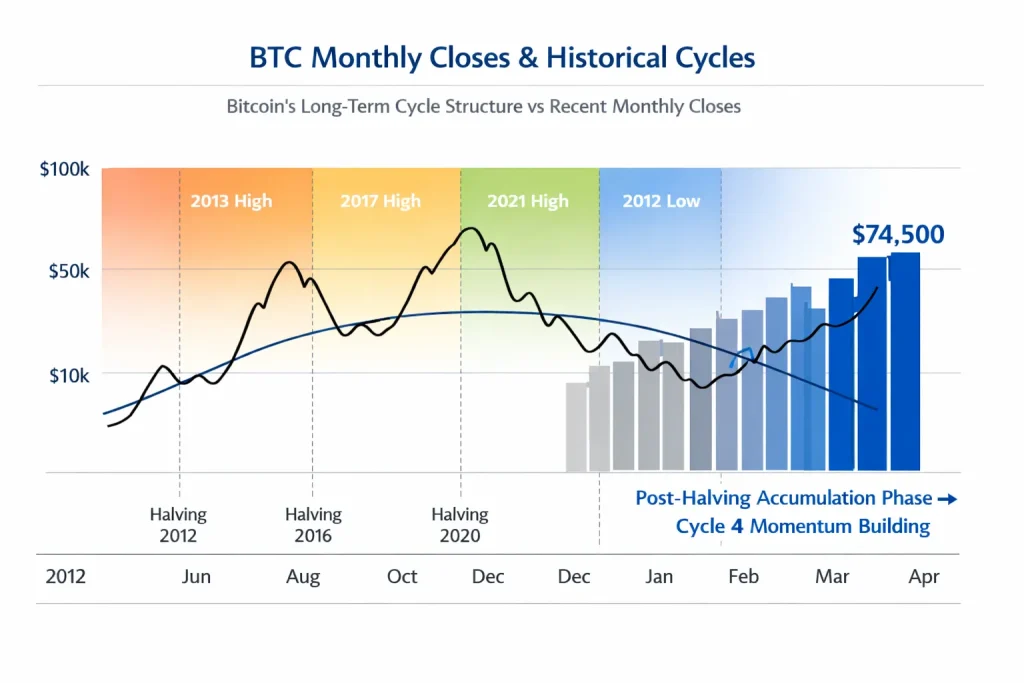
Combined, ETFs and MicroStrategy are absorbing approximately 1,638 BTC daily. For context, the network currently mints only 450 new BTC per day—a figure that will halve again to 225 BTC/day after the 2028 halving.
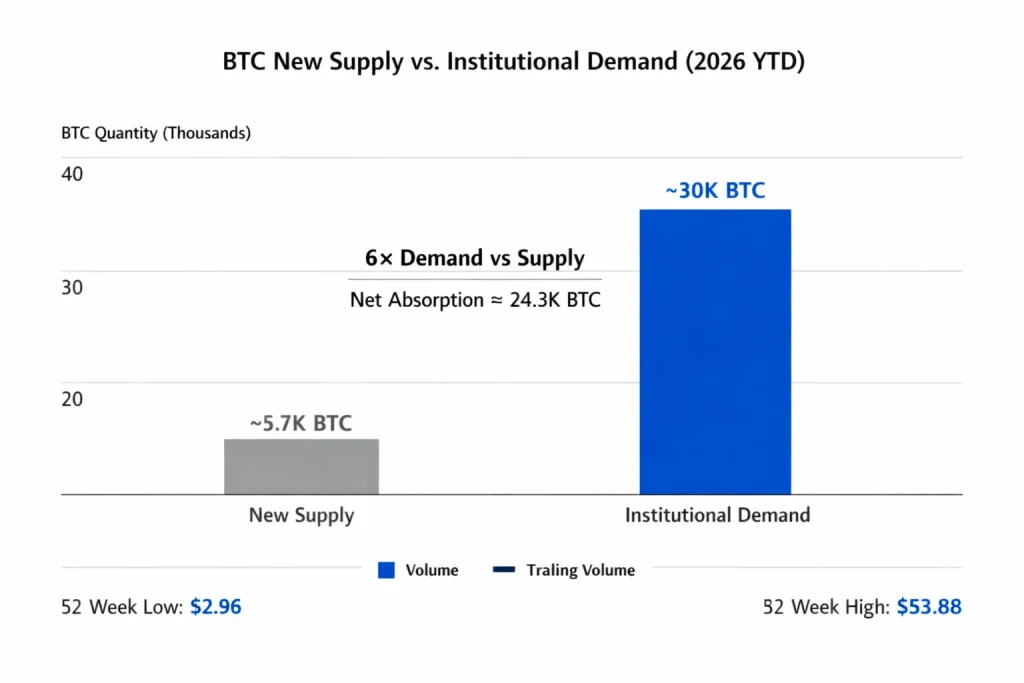
Add in other corporate buyers ($MARA, $RIOT, $TSLA, $ASST, and more), and the supply/demand imbalance is stark. Further amplifying the bullish macro is the SEC’s recent green light for tokenization of traditional securities. This development is expected to funnel fresh liquidity into crypto infrastructure projects such as $HYPE (Hyperliquid) and $ASTER, creating structural demand that extends far beyond spot Bitcoin.
Technicals: Historic Accumulation Signals and a Broken Cycle
This cycle has already produced a historic anomaly: the Pi Cycle Top indicator—reliable for every prior bull-market peak—never triggered.
Bitcoin Pi Cycle Indicator
Bitcoin has now fallen 44% from cycle highs and briefly traded below its 200-week EMA, a level that has historically marked the deepest bear-market capitulation.
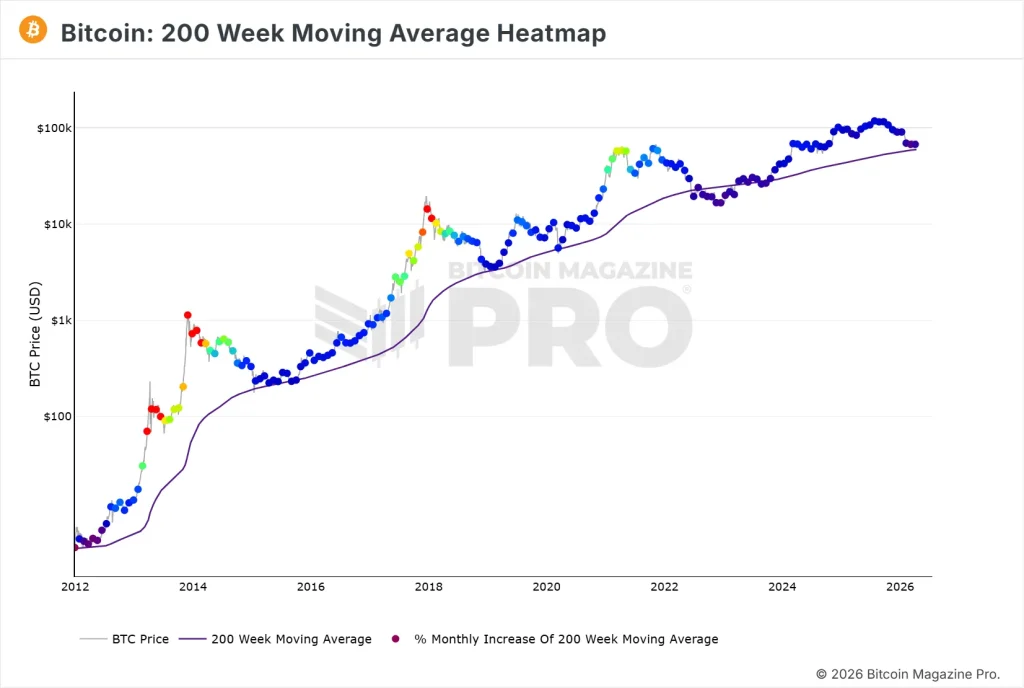
Every prior breach of the 200-week EMA (only four times since 2013) was followed by:
- Downside risk of 26–42% from those levels, followed by consolidation.
- Zero instances (outside a one-day wick in March 2020) where price ever returned to the lows once it left the range.
- Every BTC purchased below the EMA ultimately stayed profitable after the subsequent recovery.
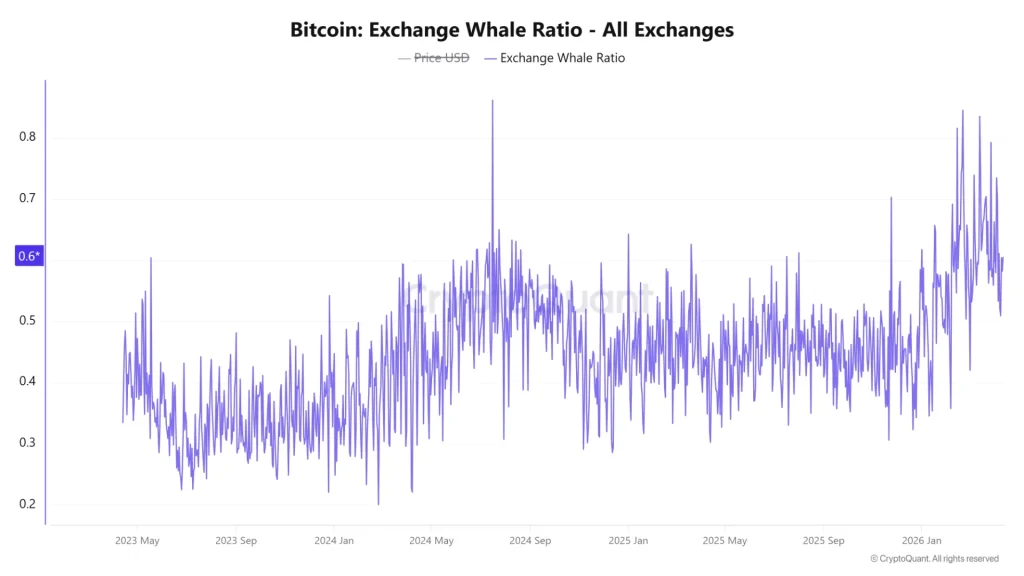
Additional on-chain and sentiment indicators reinforce the “fire sale” narrative:
The Exchange Whale Ratio has held above 0.6 for two months and spiked to 0.846 on February 21, 2026—the highest reading outside a single day in July 2024 that preceded a major breakout.
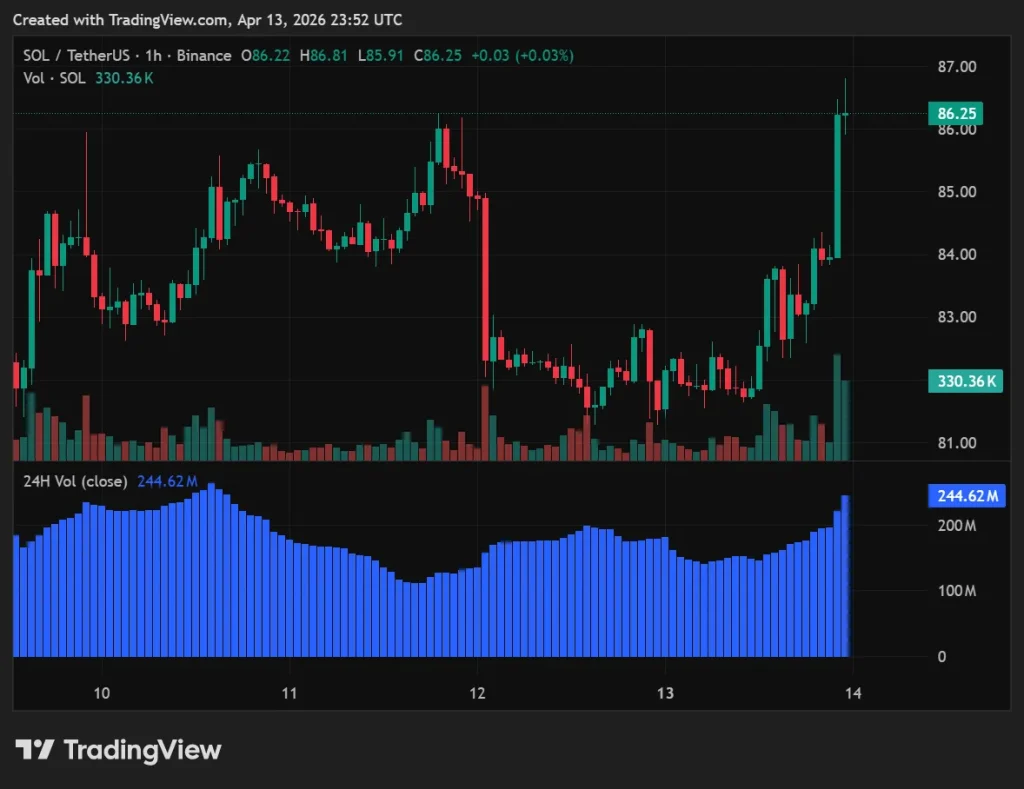
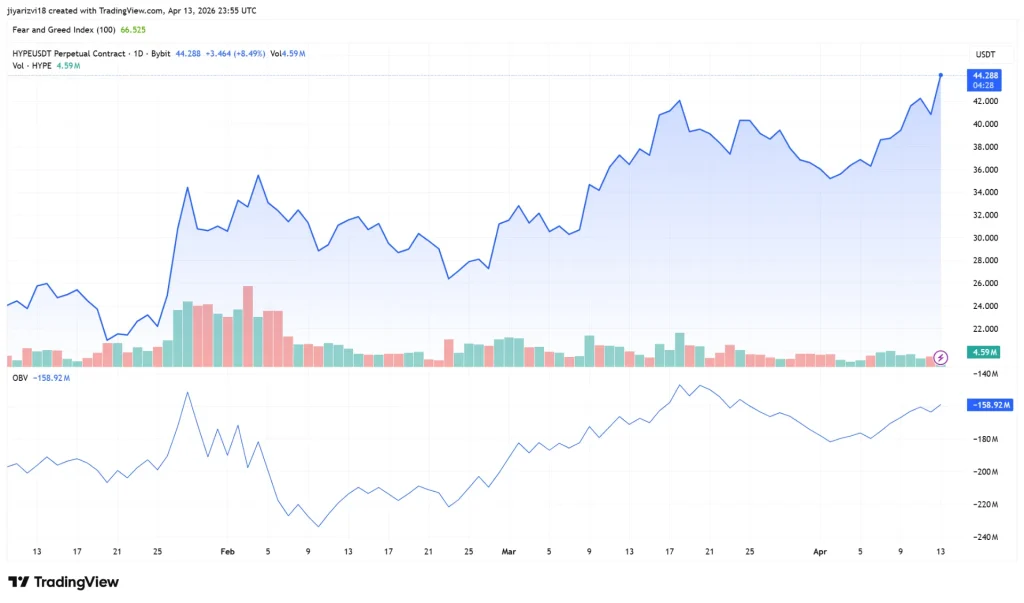
On the chart, Bitcoin is testing six-month diagonal resistance, yet On-Balance Volume (OBV) has already broken out of the same downtrend—a classic “volume precedes price” setup.
Similar bullish divergences are appearing in $SOL (breaking downtrend + OBV breakout), $ETH, and $HYPE.
Fundamentals: Why DAT Stocks Trade at Massive Discounts to NAV
Digital Asset Treasury companies operate with a simple but powerful mandate: accumulate and hold large treasuries of a target cryptocurrency (primarily BTC, but increasingly altcoins such as SOL and HYPE). They fund purchases through multiple high-efficiency channels:
- ATM equity offerings when shares trade above net asset value (NAV).
- Variable-rate preferred stock structures (e.g., $MSTR’s $STRC at ~11% yield, redeemable at $100).
- On-chain yield strategies—staking, validator commissions, DeFi monetization, and ecosystem rewards.
Because of their scale, these firms can compound holdings far faster than retail investors. More importantly, many currently trade at steep discounts to their underlying crypto NAV.
The discounts do not factor in future crypto price appreciation or the companies’ continued accumulation. A simple doubling of the underlying asset on a 50%-of-NAV stock would deliver 400% upside to NAV—before any premium the market typically awards during a bull run.
Standout Opportunities: $HYPD and $DFDV
Two names stand out for their combination of deep discounts, aggressive growth plans, and sector tailwinds:
$HYPD (Hyperliquid-focused)
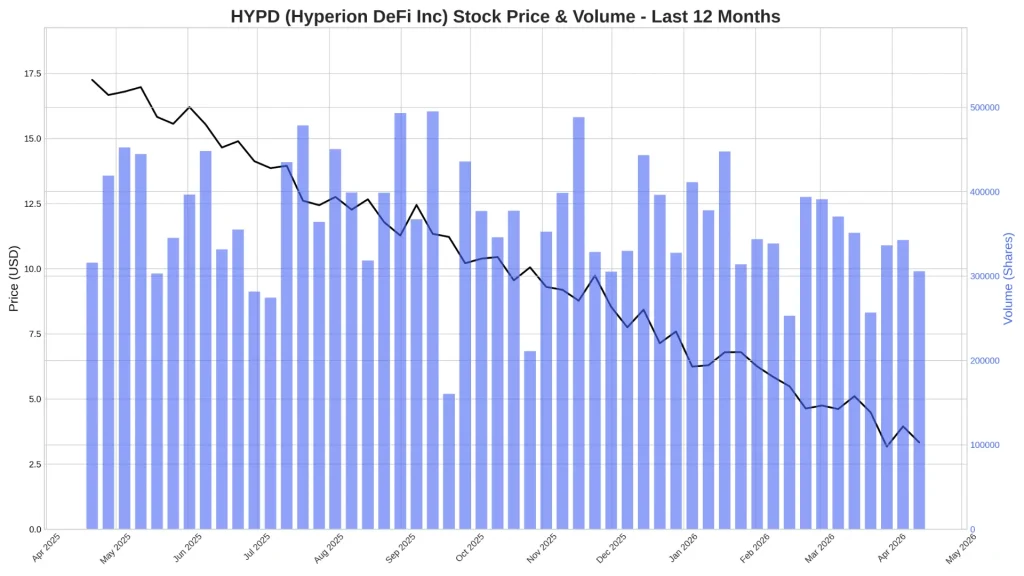
Accumulates $HYPE through staking yield, validator commissions, DeFi strategies, and ecosystem rewards. Management projects 4× gross profit growth in 2026. Hyperliquid itself generated nearly $1 billion in fees in 2025 and is positioned to dominate tokenized equity trading following the SEC’s tokenization ruling. At current levels, $HYPD offers more than 100% upside just to reach NAV, plus leveraged exposure to $HYPE’s expected growth.
$DFDV (Solana-focused)

Currently deploys on-chain yield strategies for $SOL but will soon layer on a MicroStrategy-style capital raise via its upcoming $CHAD preferred-stock vehicle. The $65 million raise is expected to push NAV to $246 million (from a $116.5 million market cap), widening the discount temporarily to ~47%. $DFDV’s stated goal is 1.0 $SOL per share by December 2028. At today’s share price of ~$3.95 and SOL at ~$81.80, that target alone implies 20.5× upside—before any bull-market multiple expansion.
Both charts show multi-month consolidations with OBV breakouts, setting the stage for technical confirmation.
The Bottom Line: Plant Seeds Before the Supply Crunch
Six straight months of red monthly closes is painful—but historically rare. The last similar stretch (August 2018–January 2019) was followed by five straight green months, an eight-month consolidation, and then a nearly 1,000% rally over the next year.
With whales, ETFs, and DATs collectively removing supply faster than miners can produce it—and with regulatory and tokenization tailwinds just beginning—the stage is set for what could be one of crypto’s most powerful moves yet.
The asymmetric risk/reward in deeply discounted DAT stocks is difficult to ignore. A prolonged Iran conflict or surprise inflation spike could delay the timeline, but the structural forces—liquidity, institutional accumulation, and a permanent reduction in liquid supply—remain firmly intact.
For investors seeking leveraged, high-conviction exposure to the next crypto cycle, Digital Asset Treasury companies offer one of the most compelling setups in the market today.

